Running a SQL Trace in the SQL Server Profiler can be a great way to track down performance problems in your ColdFusion application. However if you have tried to run one, you probably didn't see the actually SQL queries your ColdFusion application was sending, only things like this:
RPC:Completed exec sp_execute 1,2,4
The reason for this is that ColdFusion's JDBC Driver for SQL Server passes SQL statements through the sp_execute stored procedure, so you are only seeing the stored procedure call. You need to enable an event that is not enabled by default, the SP:StmtCompleted event.
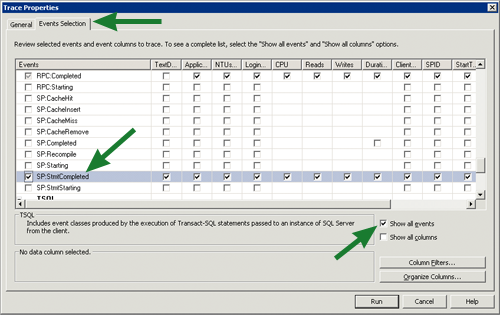
When you start your trace click on the Event Selection tab, and then check Show all events then find SP:StmtCompleted under the Stored Procedures node.
The above was tested on SQL Server 2005, you may have a different UI on previous versions.
Now when you run your trace you should see your SQL Statements in the TextData column where EventClass is SP:StmtCompleted
Comments
That would be handy as I had similar issue few days back and kept on wnodering why the queries wont show up. Thanks!