 Pete Freitag
JavaScript Debugging with Safari
By Pete Freitag
If you are doing web development or testing on Safari, JavaScript exceptions are quiet, like they are on most modern browsers (remember the days of annoying javascript error popups?). After looking around in the menus, or trying to type javascript: in the location bar (this brings up the javascript console in Mozilla) you will soon find that there is no way to see your JavaScript exceptions by default.
Safari does in-fact have some handy debugging tools for web developers (DOM Tree, User Agent Spoofing, etc), but they are all hidden and disabled by default. The easiest way to turn on the debugging menu in safari is by installing Safari Enhancer.
Update: Modern versions of Safari have a debugger builtin which you can access by enabling Show Features for Web Developers in the Advanced tab of the Safari Preferences modal. Once you enable features for web developers a Develop menu will appear.
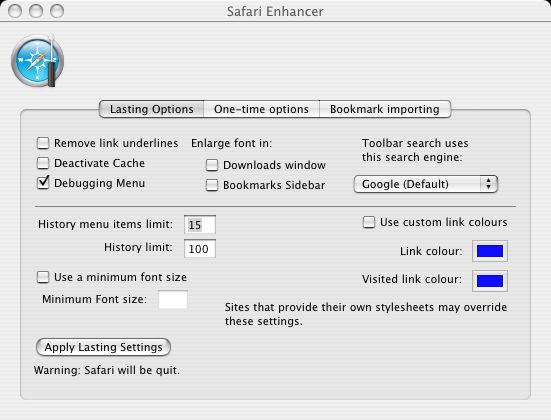
Make sure you check the box Debugging Menu, you can see that there are also some other handy features in Safari Enhancer. Click Apply Lasting Setting when your done.
Safari should reload and you will have a new menu called Debug
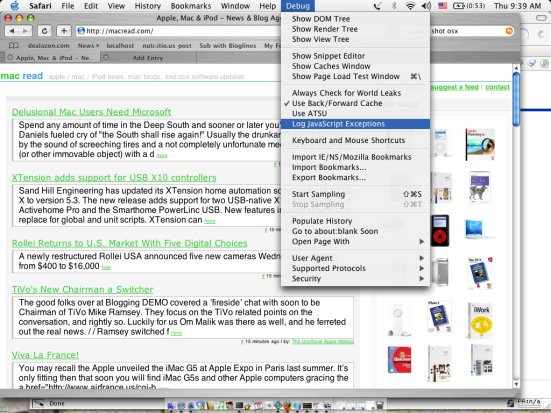
Check Log JavaScript Exceptions in the debug menu. Now javascript exceptions will show up in your Console log (Applications / Utilities / Console).
JavaScript Debugging with Safari was first published on February 17, 2005.