 Pete Freitag
Visualize Garbage Collection
By Pete Freitag
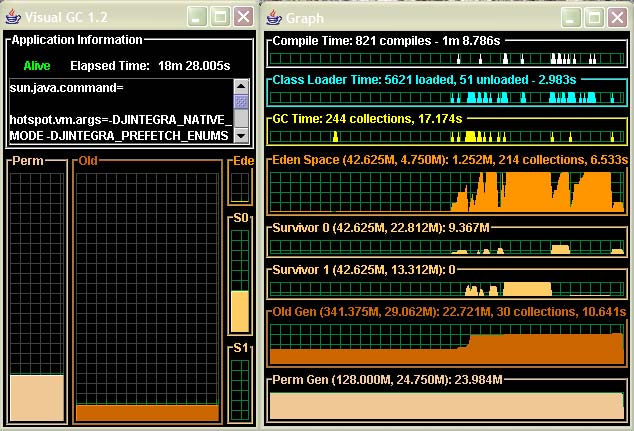
Sun has released (for free) a very cool program called Visual GC 2.0 in their jvmstat toolkit (via: Moazam Raja). The tool will show you graphically how memory is organized into generation in your JVM. This is very handy for tuning garbage collection parameters because you can see how your application uses the JVM's different generations.
For instance if we wanted to visualize garbage collection on a ColdFusion MX application server (note JVM 1.4.2 is required MX 6.1 includes uses version), the first thing we need to know is the process ID of the JVM. This can be found with the utility that comes with jvmstat called jvmps
C:\bin\jvmstat\bat>jvmps
3096
3416 jvmps.jar
From my testing you need to be running as the same user that created the JVM. So if your running ColdFusion MX as a service on Windows it is probable that the JVM is running under the SYSTEM account. To get around this run C:\CFusionMX\bin\cfstop.bat and then C:\CFusionMX\bin\cfstart.bat this will start CFMX as the user that your logged in as. If your on unix you can just su or sudo using the user CFMX is running as.
Next you just launch the visualgc program:
C:\bin\jvmstat\bat>visualgc 3096
And here's what the output might look like:
Visualize Garbage Collection was first published on June 08, 2004.
If you like reading about gc, jvm, or java then you might also like:
- ColdFusion Garbage Collection
- Tuning Garbage Collection
- Java LTS Versions Explained with EOL Dates
- Updating Java on ColdFusion or Lucee
The Fixinator Code Security Scanner for ColdFusion & CFML is an easy to use security tool that every CF developer can use. It can also easily integrate into CI for automatic scanning on every commit.
Try Fixinator
CFBreak
The weekly newsletter for the CFML Community
Comments
You can use : -m and -l options for informations about used options of the JMV running processes listed by jps.